Zimbabwe's President Robert Mugabe is under house arrest after almost four decades in power - following a military takeover. Here are 10 numbers that will help you understand how the country got to where it is now.
1 = the tally of leaders in the last 37 years
President Mugabe, who led the country's liberation movement, has been in power since independence in 1980. He served first as prime minister until the switch to a presidential system in 1987.
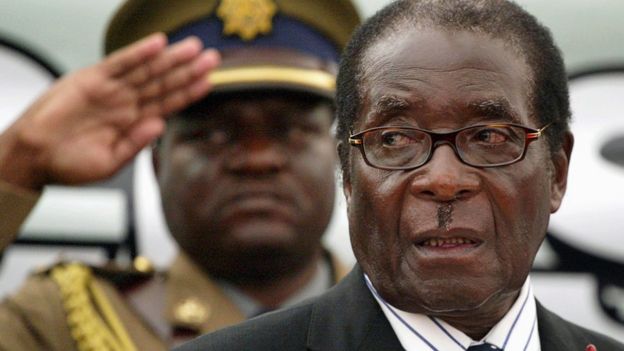 Image copyrightREUTERS
But the 93-year-old leader's years in office have been marked by economic crisis and the crushing of dissent. He and his supporters have managed to stay in power for so long by using violence and murder as an electoral strategy.

231 million per cent = inflation in July 2008
Zimbabwe's economy has struggled since land reforms were introduced in 2000.
The programme that saw white-owned farms redistributed to landless black Zimbabweans - and those with good political connections - led to sharp falls in production.
As the country's central bank printed money to try to get out of the crisis, rampant inflation took hold.
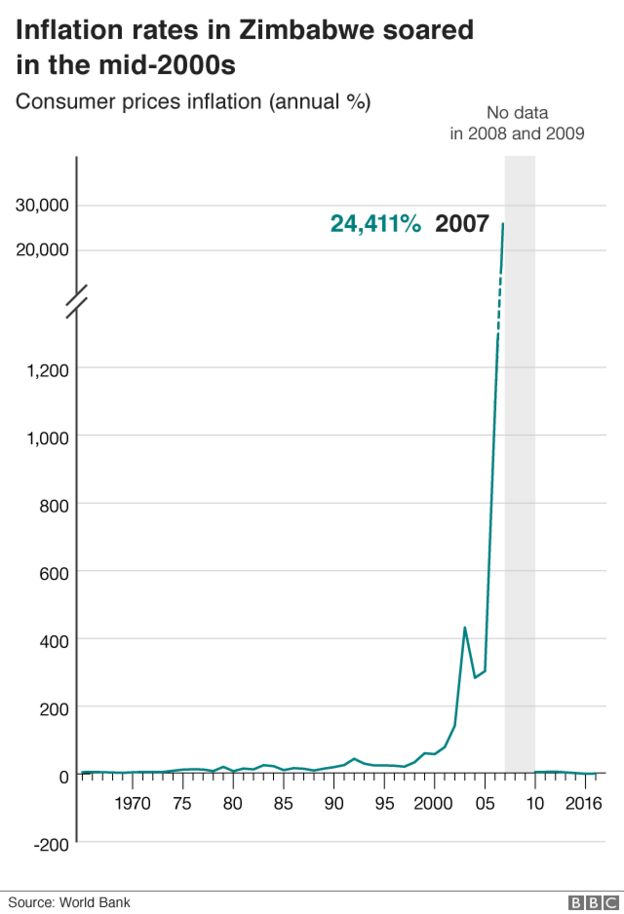
Although the World Bank does not have figures for 2008 and 2009, numbers from Zimbabwe's central bank showed annual inflation reached 231 million % in July 2008. Officials gave up reporting monthly statistics when it peaked at just under 80 billion % in mid-November 2008.
The country was forced to abandon its own currency a year later at a rate of Z$35 quadrillion to US$1.
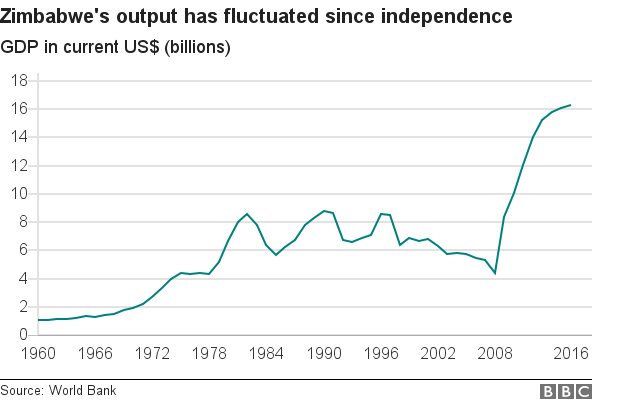
$16.3bn = GDP in 2016
The political and economic crises between 2000 and 2008 nearly halved Zimbabwe's GDP - the biggest contraction in a peacetime economy, according to the World Bank.
A brief period of recovery between 2009 and 2012 has now faltered and the economy faces serious challenges, says the World Bank. Growth has slowed sharply from an average 8% from 2009 to 2012, caused by shifts in trade and a series of major droughts.
President Mugabe has always blamed Zimbabwe's economic problems on a plot by Western countries, led by the UK, to oust him because of his seizure of white-owned farms.
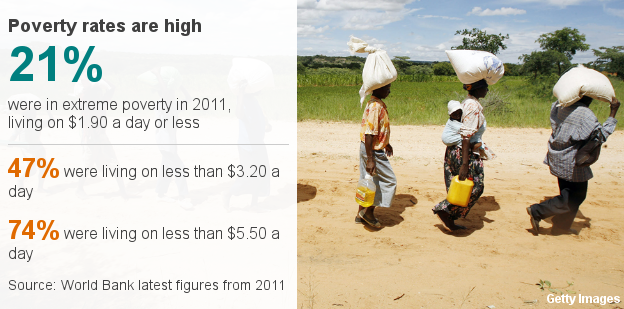
74% = the population living on less than $5.50 a day
The country's political and economic crises have resulted in high poverty rates.
The hard years between 2000 and 2008 saw poverty rates increase to more than 72%, according to the World Bank. It also left a fifth of the population in extreme poverty.
Extreme poverty, estimated to have fallen from 2009 to 2014, is now projected to have risen again substantially.
About 27% of children under the age of five suffer stunted growth, with 9% severely stunted because of poor nutrition, the 2015 Zimbabwe Demographic and Health Survey report revealed.
But poverty in Zimbabwe is still lower than in the rest of Sub-Saharan Africa, where about 41% of the population were living on less than $1.90 a day in 2013, World Bank data suggests.
90% = one estimate of the unemployment rate
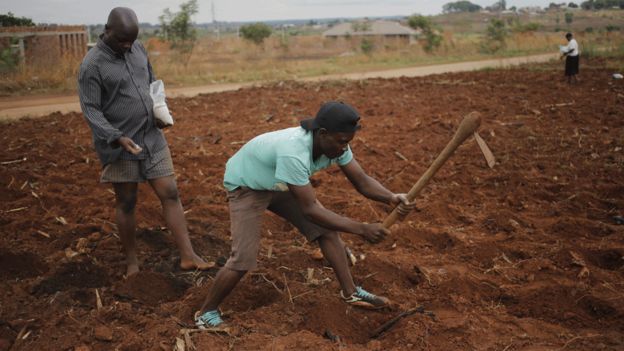 Image copyrightEPA
Estimates of the country's unemployment levels vary wildly.
The World Bank's modelled estimates based on the International Labour Organisation data puts the figure as low as 5% in 2016, while Zimbabwe's biggest trade union claims the jobless rate was as high as 90% this year.
However, the World Bank's definition only covers those actively "seeking" work. Many of those not counted may not seek a job despite wanting one because they "view job opportunities as limited, or because they have restricted labour mobility, or face discrimination, or structural, social or cultural barriers".
The CIA world factbook estimates the rate was 95% in 2009, but says current figures are not known.
89% = adult literacy rate
Due to large investments in education since independence, Zimbabwe has one of the highest adult literacy rates in Africa, with 89% of the adult population literate, according to World Bank data from 2014.
Globally, the literacy rate stood at 86% in 2016, while in sub-Saharan Africa it was 64% (2015 figs).
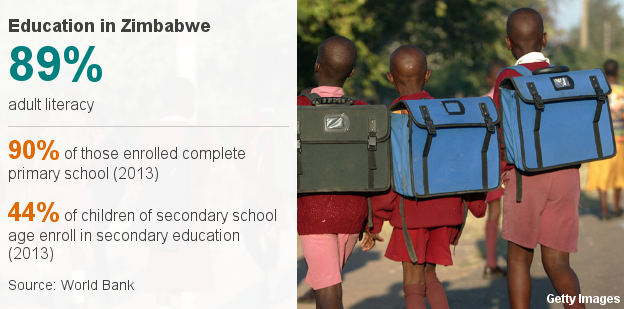
Almost all women and men aged 15-49 have had at least some primary education, according to the 2015 Zimbabwe Demographic and Health Survey. More than 70% of people aged 15-49 have also attended secondary school.
13.5% = the adult prevalence rate of HIV/Aids
Zimbabwe has the sixth highest HIV prevalence in sub-Saharan Africa, with 1.3 million people living with HIV in 2016, according to UNAIDS.
However, after a peak in 1997, rates are declining.
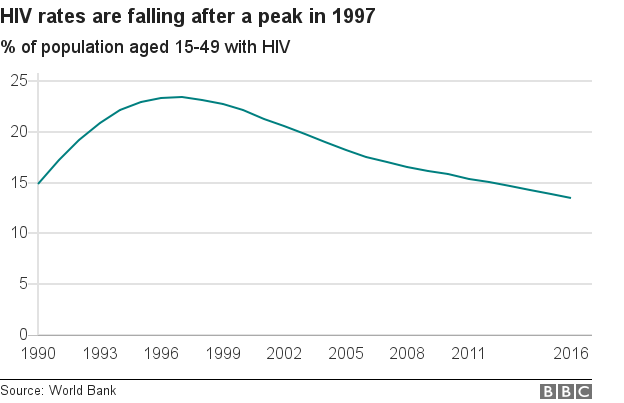
According to the UN, this is a result of successful campaigns encouraging condom use as well as programmes preventing the transmission of infection from mother to child. Treatment and support services have also improved.

60 = the life expectancy at birth
Life expectancy fell in the 1990s, with the HIV/Aids epidemic a major killer. It dropped from a high of 61.6 years in 1986 to 43.1 years in 2003.
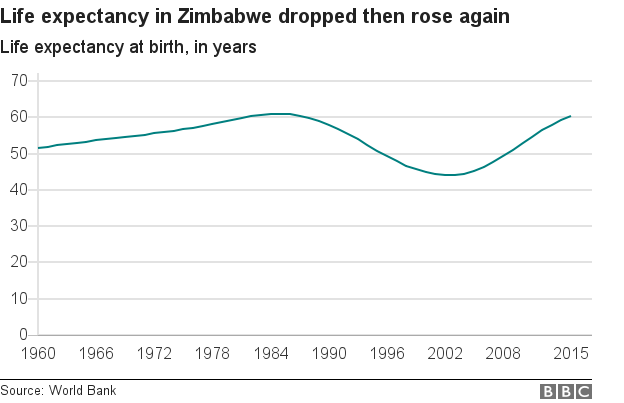
It is now steadily improving again, but with unemployment and poverty endemic and HIV/Aids rates still high, it remained at just 60 in 2015, according to World Bank data.
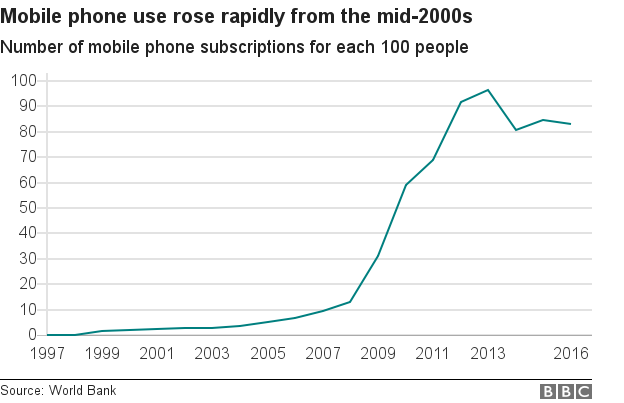
81 = the number of mobile subscriptions per 100 people
Mobile devices are the leading communication tool for Zimbabweans.
But while most have a mobile phone, only 43% of households have a radio, 37% have a television and 10% have a computer, according to the 2015 Zimbabwe Demographic and Health Survey.
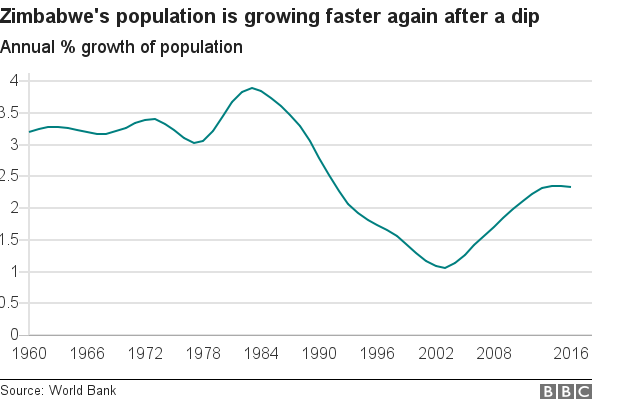
16.7 million = the current population
After a growth spurt after independence in 1980, a decline in birth rates and a rise in death rates saw population growth slide downwards.
With high outward migration rates also high, the population has not recovered its post-independence growth.
Comments